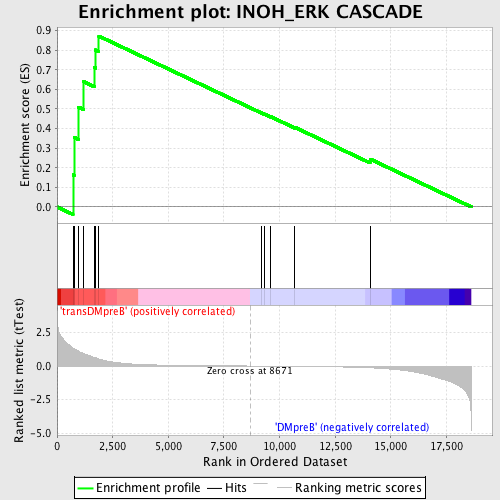
Profile of the Running ES Score & Positions of GeneSet Members on the Rank Ordered List
| Dataset | Set_04_transDMpreB_versus_DMpreB.phenotype_transDMpreB_versus_DMpreB.cls #transDMpreB_versus_DMpreB.phenotype_transDMpreB_versus_DMpreB.cls #transDMpreB_versus_DMpreB_repos |
| Phenotype | phenotype_transDMpreB_versus_DMpreB.cls#transDMpreB_versus_DMpreB_repos |
| Upregulated in class | transDMpreB |
| GeneSet | INOH_ERK CASCADE |
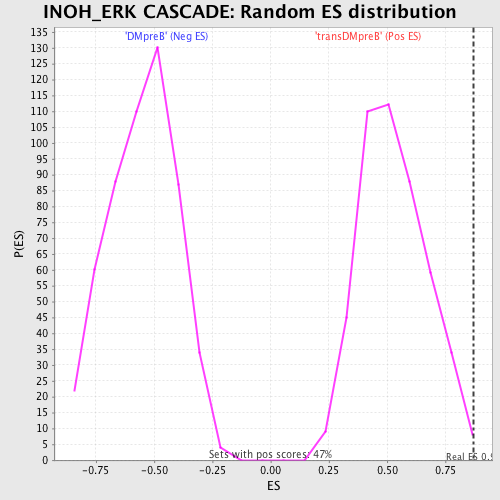
| Enrichment Score (ES) | 0.8717608 |
| Normalized Enrichment Score (NES) | 1.6547917 |
| Nominal p-value | 0.008602151 |
| FDR q-value | 0.15658683 |
| FWER p-Value | 0.61 |
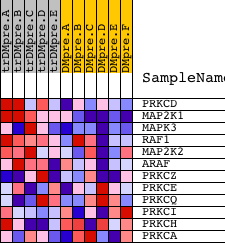
| PROBE | DESCRIPTION (from dataset) | GENE SYMBOL | GENE_TITLE | RANK IN GENE LIST | RANK METRIC SCORE | RUNNING ES | CORE ENRICHMENT | |
|---|---|---|---|---|---|---|---|---|
| 1 | PRKCD | 21897 | 716 | 1.338 | 0.1637 | Yes | ||
| 2 | MAP2K1 | 19082 | 767 | 1.285 | 0.3551 | Yes | ||
| 3 | MAPK3 | 6458 11170 | 961 | 1.090 | 0.5094 | Yes | ||
| 4 | RAF1 | 17035 | 1186 | 0.942 | 0.6397 | Yes | ||
| 5 | MAP2K2 | 19933 | 1669 | 0.648 | 0.7116 | Yes | ||
| 6 | ARAF | 24367 | 1729 | 0.613 | 0.8011 | Yes | ||
| 7 | PRKCZ | 5260 | 1877 | 0.520 | 0.8718 | Yes | ||
| 8 | PRKCE | 9575 | 9170 | -0.006 | 0.4807 | No | ||
| 9 | PRKCQ | 2873 2831 | 9311 | -0.008 | 0.4744 | No | ||
| 10 | PRKCI | 9576 | 9605 | -0.012 | 0.4604 | No | ||
| 11 | PRKCH | 21246 | 10685 | -0.026 | 0.4064 | No | ||
| 12 | PRKCA | 20174 | 14071 | -0.131 | 0.2443 | No |